
Dashboards & Analytics
Business Intelligence Solutions
Create a single, reconciled source of reporting truth so finance, sales and operations stop bringing conflicting numbers to meetings.
As organisations add separate tools for invoicing, payroll, inventory, CRM and job management, reporting quickly fractures. Different departments export CSVs at different times of day, apply slightly different filters, and arrive at incompatible totals.
Our Business Intelligence (BI) solutions establish the structured data foundation underneath your reporting: automated ingestion pipelines, clean dimensional staging tables, documented business logic, and governed datasets ready for executive reporting.
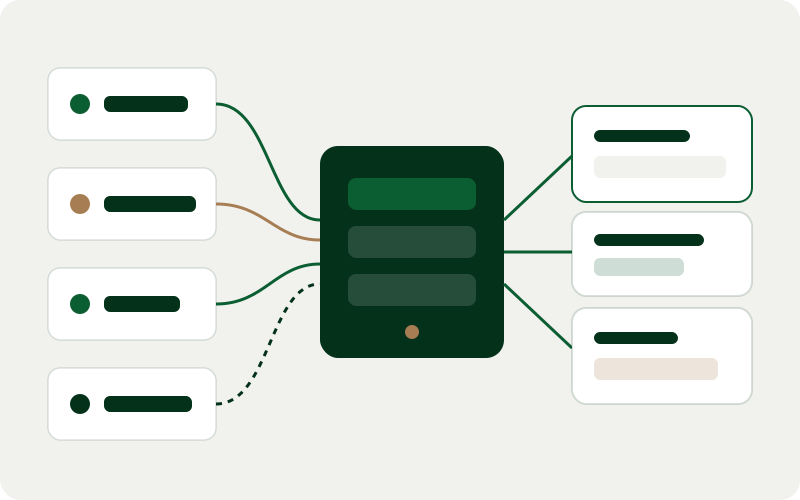
Connected Sources
4 systems
ERP, CRM, Roster, POS
Scheduled Sync
05:30 AEST
Automated daily checks
Schema Tests
Passing
Null & duplicate guards
Typical Architecture Layers
- 1Operational Connectors
- 2Staging & Cleansing
- 3Dimensional Star Schema
- 4Governed Reporting Views
Deliverables & scope boundaries
Clear boundaries prevent project surprises. Below is what a typical business intelligence solutions engagement includes—and what sits outside scope unless separately agreed.
What this service includes
- Audit of existing spreadsheets, reports and source databases across departments
- Design and implementation of a centralised reporting database or analytical data warehouse
- Automated ETL/ELT pipelines with error logging and stale-data alerts
- Standardised metric definitions (revenue recognition rules, margin formulas, active status logic)
- Data quality assertions checking for duplicate records, missing keys and schema drift
- Handover runbooks for internal finance, operations or IT administrators
Explicitly excluded from standard scope
- Statutory financial audit sign-off or tax accounting advice
- Vendor licence procurement markup—licences remain directly in your company name
- 24/7 pager duty unless covered by a separate maintenance agreement
Who this service suits
- Multi-site or multi-entity Australian businesses consolidating figures across branches
- Finance and operations leads spending days at month-end manually merging CSV exports
- Organisations preparing clean historical reporting ahead of strategic planning or expansion
Inputs needed from your team
To keep delivery smooth and avoid assumptions, we ask your team for:
- Examples of current monthly or weekly management packs
- Agreement from department leads on canonical definitions for shared metrics
- Cloud account or database environment where analytical tables will reside
How delivery works
Step 01
Source & Discrepancy Audit
Catalog every current report, trace where numbers diverge, and inspect source APIs or databases.
Step 02
Data Model Design
Structure clean fact and dimension tables so historical trends and cross-system joins stay accurate.
Step 03
Pipeline & Alerting Build
Implement scheduled sync jobs, transformation scripts and automated notifications if a feed fails.
Step 04
Reconciliation & Handover
Verify outputs line-by-line against known period totals with your finance or operations team.
Common questions about business intelligence solutions
Do we need an expensive enterprise data warehouse to get started?
Rarely for SMEs. Many small and mid-sized Australian businesses have data volumes that run briskly and affordably on a well-indexed PostgreSQL database or lightweight cloud analytical store.
What happens when a third-party API changes or goes offline temporarily?
Pipelines are built idempotently with retry logic and schema checks, alerting designated staff rather than silently writing partial or duplicated rows.
Can our own analysts query the reporting layer directly?
Yes. Read-only reporting views are documented clearly so authorised analysts or BI tools can query them safely.
Related services
Discuss business intelligence solutions for your business
Share a short overview of your current tools and goals—we will outline a practical scope, expected inputs and sensible next steps.